Highly Recommend using repo here -Day13 to practise this project instead of code snippets, In case of confusion, Please do watch video that is explained in English, the code here in the blog is not changed to keep screenshots intact
You can use this Repository for this Project
git clone https://github.com/sagarkakkalasworld/Day13
Prometheus Overview
For any kind of troubleshooting or observability, we go through three types namely Metrics, Traces and Logs
While logs and traces help in identifying the issue in a deeper level, Prometheus is designed specifically to target on Metrics as this would be first layer of Observability
Prometheus is a time series data base, and for prometheus to get data from instances, we often need an exporter, most cases node exporter tool is widely used
Prometheus calculates time in milliseconds starting from Unix epoch (January 1, 1970, UTC) which helps Prometheus to measure and track time with high precision.
just like Node Exporter tool, Prometheus is widely installed with Alert Manager which would help in receiving alerts based on prometheus rules that are set
And since Prometheus make it harder for us to run queries like cpu uptime 2m ago eg: rate(node_cpu_seconds_total[2m]), this is where Grafana helps us making the monitoring ease with Visualization
Installing Prometheus via Helm Chart
Prerequisites- Kubernetes and Helm charts must be installed, you can check the following links if not installed already - Kubernetes Blog and Helm Charts Blog
Now once kubernetes and Helm Charts are installed, let us create a kubernetes namespace first
kubectl create ns monitoringNow let us install official Prometheus Helm chart - Prometheus Official Helm chart
helm repo add prometheus-community https://prometheus-community.github.io/helm-chartshelm repo updateNow install Prometheus Helm Chart in namespace that we created
helm install prometheus prometheus-community/prometheus -n monitoringTroubleshooting on Pending pods to bound PVC's
Once installed, you will find two pods in pending state
kubectl get pods -n monitoring As you can see from above screenshot, that prometheus-alertmanager-0 and prometheus-server-7bcb76c7b-lszww are in pending state, now if you describe both the pods respectively
Note: also node-exporter pod would be installed as daemon set as to export data from the new pods that will be created
kubectl describe pod prometheus-alertmanager-0 -n monitoringand other pod would have same issue as shown in above screenshot that PVC is not bound, let us check PVC in the same namespace
kubectl get pvc -n monitoringAs you could see from above screenshot, both the PVC are in pending state, to create PV that can bound check the details of existing PVC to create similar PV that we can bound, As PV and PVC are bound by storage capacity, Access Modes,
you can use edit command to check pvc details with below command
kubectl edit pvc prometheus-server -n monitoringyou will be able to find following details as mentioned in above screenshot
similarly you can check the specification for other pvc as well, you can use the pv files as mentioned below
Before proceeding on creating PVC, lets create mount path for prometheus and alert manager
sudo mkdir -p /mnt/data/prometheusand now set all permissions
sudo chmod 777 /mnt/data/prometheusNow similarly for alert Manager
sudo mkdir -p /mnt/data/alertmanagernow set all permissions
sudo chmod 777 /mnt/data/alertmanagerNow lets add the mount path of alertmanager and PVC
save the below contents in prometheus-server-pv.yaml
apiVersion: v1
kind: PersistentVolume
metadata:
  name: prometheus-server-pv
  labels:
    app.kubernetes.io/name: prometheus
    app.kubernetes.io/part-of: prometheusspec:
  capacity:
    storage: 8Gi  # Ensure this matches the PVC's request
  accessModes:
    - ReadWriteOnce  # Ensure this matches the PVC's access mode  # Adjust this to a valid path on the node(s)
  volumeMode: Filesystem
  hostPath:
    path: /mnt/data/prometheus
similarly for alert-manager pv
save the below contents in alert-manger-pv.yaml
apiVersion: v1
kind: PersistentVolume
metadata:
  name: prometheus-alert-manager-pv
  labels:
    app.kubernetes.io/instance: prometheus
    app.kubernetes.io/name: alertmanager
spec:
  capacity:
    storage: 2Gi
  volumeMode: Filesystem
  accessModes:
    - ReadWriteOnce
  hostPath:
    path: /mnt/data/alertmanager
Now let us make both PV's up so that they can bound with PVC's
kubectl apply -f prometheus-server-pv.yaml -n monitoringkubectl apply -f alert-manger-pv.yaml -n monitoringNow let us check the PV we created, it might take few mins to bound with PVC
kubectl get pv -n monitoringAs seen from above screenshot pv's are bound, you can verify your PVC's even now
kubectl get pvc -n monitoringAs seen from image, it is shown that both the PVC are bound with PV that we created
Now let us check the Pods status
kubectl get pods -n monitoringAs you see from above screenshot, both the pods are up now
Accessing Prometheus Server using NodePort
Now let us access our prometheus server,
kubectl get svc -n monitoringAs from above screenshot, since our prometheus server is on clusterip, let us change it to NodePort, so we can access our prometheus server from outside our instance
kubectl edit svc prometheus-server -n monitoringAs shown in above screenshot, change type from ClusterIp to NodePort
Now if you check services in monitoring namespace again, you will be able to find the NodePort
Now if you check services in monitoring namespace again, you will be able to find the NodePort
kubectl get svc -n monitoring
You can access Prometheus-Server at http://AWS_EC2_PUBLIC_IP:NODEPORT/
This is how prometheus server looks like, you can now go for Status > Service Discovery , to check what files does prometheus scrape for us
You can also go for status> Targets, to check what we have there
Modifying Scrape_Config file for Application with NameSpace label
Now let us use prometheus config file to scrape the data from our application
since, prometheus is installed using helm charts, we need to modify values.yaml to scrape our application
since prometheus-community/prometheus is the chart we installed, let us get values from there using the following command
helm show values prometheus-community/prometheus -n monitoring > values.yamlNow let us adjust values.yaml file to scrape data using namespace label
under scrape_configs file add the below job
  - job_name: 'my-react-nginx-pods'
    kubernetes_sd_configs:
      - role: pod
    relabel_configs:      - source_labels: [__meta_kubernetes_namespace]
        action: keep
        regex: react-nginx #change namespace name to your preferred one
Make sure, you get indentation right or else pod will not be up, also make sure you are not intervening between other jobs
Now, since we want helm chart to take these new values.yaml file, let us do a helm upgrade of installed prometheus chart but with new values.yaml file
helm upgrade prometheus prometheus-community/prometheus -f values.yaml -n monitoringNow for changes to take place, you need to restart prometheus pod,
kubectl delete pod prometheus-server-7bcb76c7b-lszww -n monitoring#replace above command with your prometheus-server
Since, we have done helm upgrade,we need to change our prometheus server from clusterip to NodePort again, to avoid this you can update values.yaml file
follow the same steps again as we followed above to change it to NodePort
Now once we access the Prometheus Server, Go for Status> targets and then search our job name in Targets
As you can see from above screenshot, it shows pod status as down even though pods are up, this is because it searching for metrics api in our nginx application, since we do not have an nginx application, it shows the error
In such scenarios, we get metrics path and metrics port from developers for the application
Using Nginx exporter for Metrics API
But in our case, we can use nginx exporter to get metrics as our application is running on nginx,
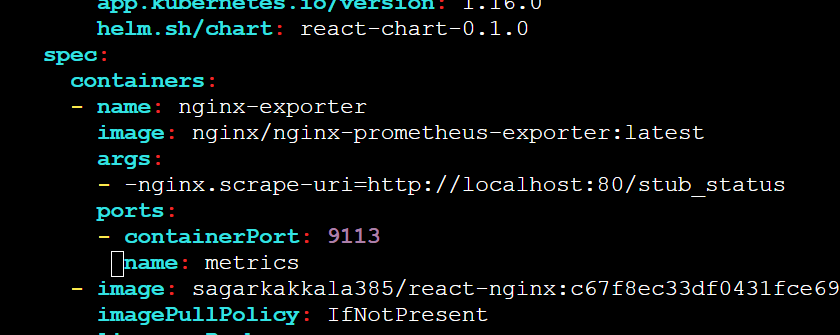
for that we need to modify our deployment file in the following way
###add these annotations to deployment
    prometheus.io/path: /metrics
    prometheus.io/port: "9113"
    prometheus.io/scrape: "true"
##add this side car container for deployment
- name: nginx-exporter
  image: nginx/nginx-prometheus-exporter:latest
  args:
    - -nginx.scrape-uri=http://localhost:80/stub_status
  ports:
    - containerPort: 9113
      name: metrics
##supporting blog if you wish to learn more - https://sysdig.com/blog/monitor-nginx-prometheus/
In case you have an nginx application, you can use the above modifications to your application
In case you want to test the application, you can use the below deployment file
apiVersion: apps/v1
kind: Deployment
metadata:
  name: react-chart
  namespace: react-nginx
  labels:    app: react-demo
  annotations:
    deployment.kubernetes.io/revision: "9"
    meta.helm.sh/release-name: react-chart
    meta.helm.sh/release-namespace: default
    prometheus.io/path: /metrics
    prometheus.io/port: "9113"
    prometheus.io/scrape: "true"
spec:
  replicas: 2
  selector:
    matchLabels:
      app: react-demo
  template:
    metadata:
      labels:
        app.kubernetes.io/instance: react-chart
        app.kubernetes.io/managed-by: Helm
        app.kubernetes.io/name: react-chart
        app.kubernetes.io/version: 1.16.0
        helm.sh/chart: react-chart-0.1.0
    spec:
      containers:
      - name: react-demo
        image: sagarkakkala385/react-nginx:latest
        ports:
        - containerPort: 80
      - name: nginx-exporter
        image: nginx/nginx-prometheus-exporter:latest
        args:
          - -nginx.scrape-uri=http://localhost:80/stub_status
        ports:          - containerPort: 9113
            name: metrics
The above deployment says that our metrics server for application is accessible at port 9113 with path metrics i.e, http://POD_IP:9113/metrics
Since our deployment is already running, let us edit deployment file
kubectl edit deploy react-chart -n react-nginxNow check whether pods are up with new containers
kubectl get pods -n react-nginxSince the pods are now up,let us modify our values.yaml to scrape data of our application from metrics port 9113
since we have already copied values.yaml of chart, we can use the same values.yaml file to edit
vi values.yamland add the below job under scrape_configs
      - job_name: 'react-nginx-pods'
        kubernetes_sd_configs:
          - role: pod
        relabel_configs:
      # Keep only pods in the 'react-nginx' namespace
          - source_labels: [__meta_kubernetes_namespace]
            action: keep
            regex: react-nginx
          - source_labels: [__meta_kubernetes_pod_annotation_prometheus_io_path]
            action: replace
            target_label: __metrics_path__
            regex: (.+)
          - source_labels: [__meta_kubernetes_pod_ip]
            action: replace
            replacement: '$1:9113'
            target_label: __address__
now, let us upgrade our helm chart again
helm upgrade prometheus prometheus-community/prometheus -f values.yaml -n monitoringOnce updated, you need to change Prometheus Service from Cluster Ip to NodePort and also restart Prometheus Pod
Now if you access prometheus sever , Status> Targets and look for job name "react-nginx-pods", you will be able to see that our pods are up and metrics server is accessible
Note: Service Discovery file is only to scrape data, In case if we need alerts, we need to set rules and configure alert manager which we will discuss on our upcoming sessions
Note: since updating values.yaml everytime makes us complicated in case we want to update prometheus as we have to manually enter our newly added scrape config files every time when prometheus upgrade is released, to overcome this issue, we will discuss about using ServiceMonitor CRD in next session
Now let us also know Grafana Integration with Prometheus
Grafana Integration with Prometheus
As a first step let us install Grafana using Helm charts - Grafana Official Helm Chart
helm repo add grafana https://grafana.github.io/helm-chartshelm repo updatehelm install grafana-dashboard grafana/grafanaAccessing Grafana through NodePort
Now let us access grafana,
kubectl get svcsince we installed grafana in default namespace
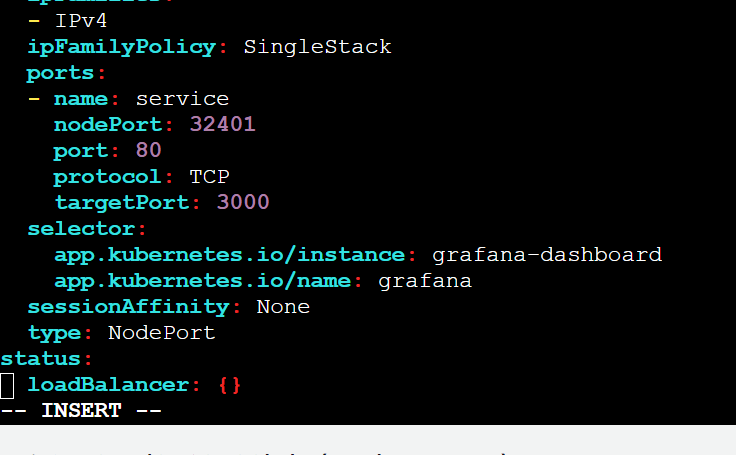
Now covert grafana-dashboard svc from clusterip to NodePort
kubectl edit svc grafana-dashboardNow if you check services, you will get nodeport and you can access Grafana at http://AWS_EC2_PUBLIC_IP:NODEPORT
Grafana Password from Kubernetes Secrets
Once you access grafana-Dashboard, it will ask for username and password,
By default, username will be admin
and to get password, we need to access grafana secret
kubectl get secretskubectl get secret grafana-dashboard -o jsonpath="{.data.admin-password}" | base64 --decodeConfiguring Data Source in Grafana
Now use this password to login
click on data sources to add prometheus data source
select prometheus
verify in your server in which port is prometheus running
Update the prometheus URL
click on save and test
Creating Dashboard in Grafana
Now go to Grafana Home Page
Go for Menu > Dashboards
Click on New > Import
By default grafana has some dashboards configured which makes our job easy and for prometheus, the id is 3662
Select Prometheus as data source and click on import
Now we have our Dashboard ready
This concludes our blog.
🔹 Important NoteAlso, before proceeding to the next session, please do the homework to understand the session better - DevOps Homework
I Post most of my content in Telugu related to contrafactums(changing lyrics to original songs),fun vlogs, Travel stories and much more to explore, You can use this link as single point of link to access - Sagar Kakkala One Stop
🖊feedback, queries and suggestions about blog are welcome in the comments.


Comments
Post a Comment